CheeLinks
Search
All Topics
The World
Next
Previous
Collapse Subtopics
Supertopics:
Economic Charts, Graphs, and Maps 2014 through 2023
Economic Charts, Graphs, and Maps 2017
Subtopics:
Economic Charts, Graphs, and Maps 2018 part two
wildfires contributing more to Sacramento air pollution
web
Climate Central
2017-11-07
atmospheric carbon dioxide is surging
web
NASA
EcoWatch
2017-10-30
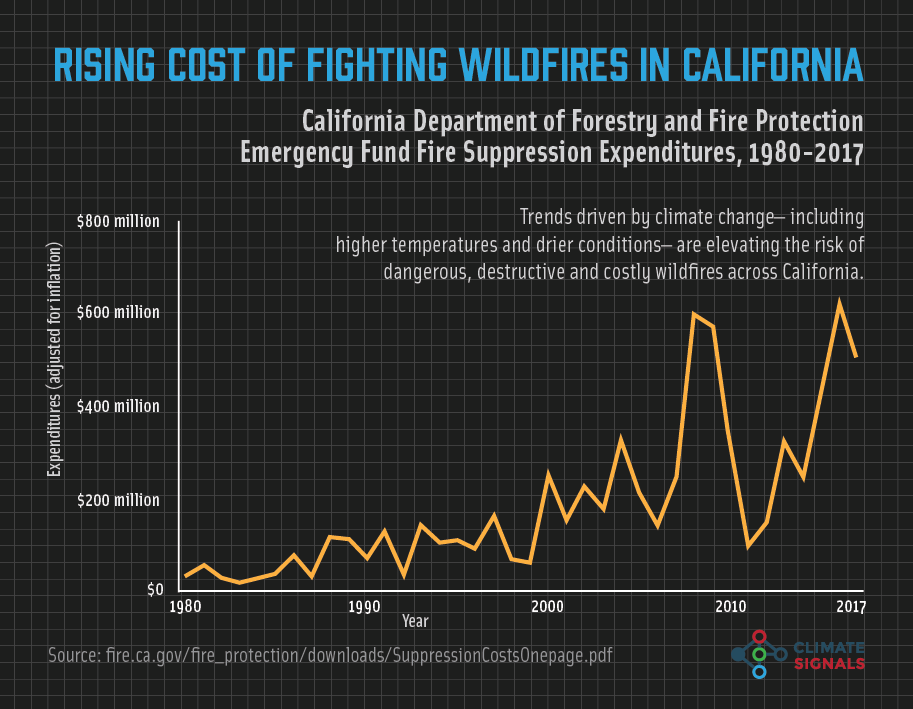
the rising cost of fighting wildfires in California
web
Nexus Media
2017-10-18
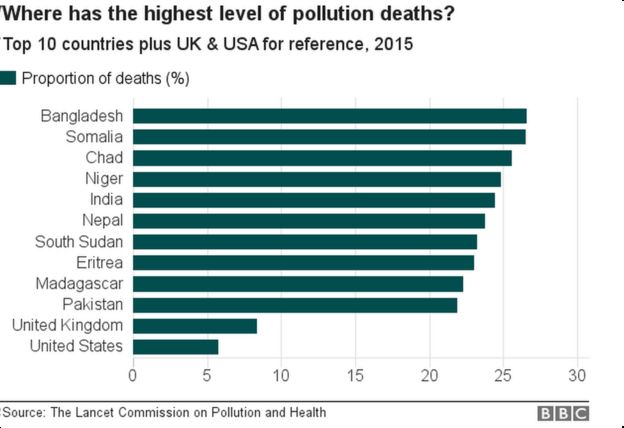
nations with the highest level of pollution deaths
web
Economic Charts, Graphs, and Maps 2018 part one
the oil and gas pollution threat map
web
Earthworks
US national debt is still growing
web
US is still consuming a lot more oil than it is producing
web
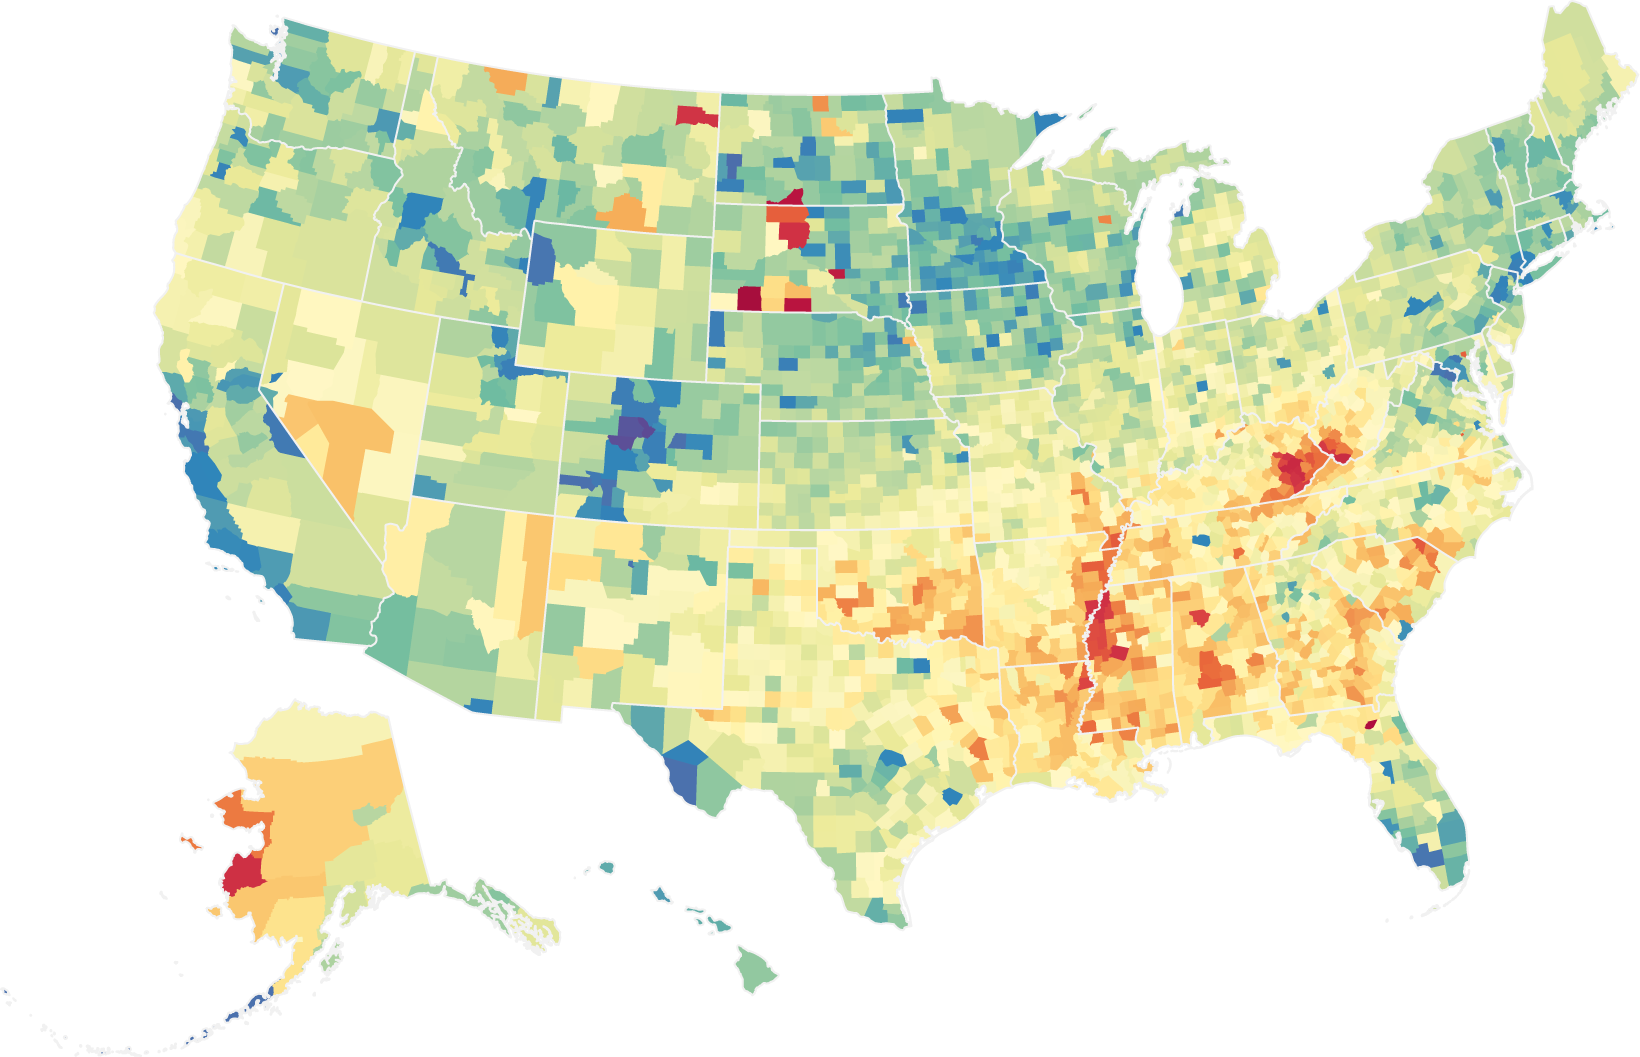
map of life expectancy by US county, 2014
web
JAMA Intern Med
2017-05-08
US vegetable oil consumption 1970 to 2010
web
Vox
2017-02-02
map of the re-routing of the Dakota Access Pipeline
web
Reuters
global temperature anomaly, 1880 through 2016
web
/cdn0.vox-cdn.com/uploads/chorus_asset/file/7917595/Screen_Shot_2017_02_02_at_11.30.31_AM.png)