CheeLinks
Search
All Topics
The World
Next
Previous
Collapse Subtopics
Topics:
Economic Charts, Graphs, and Maps 2011 part two
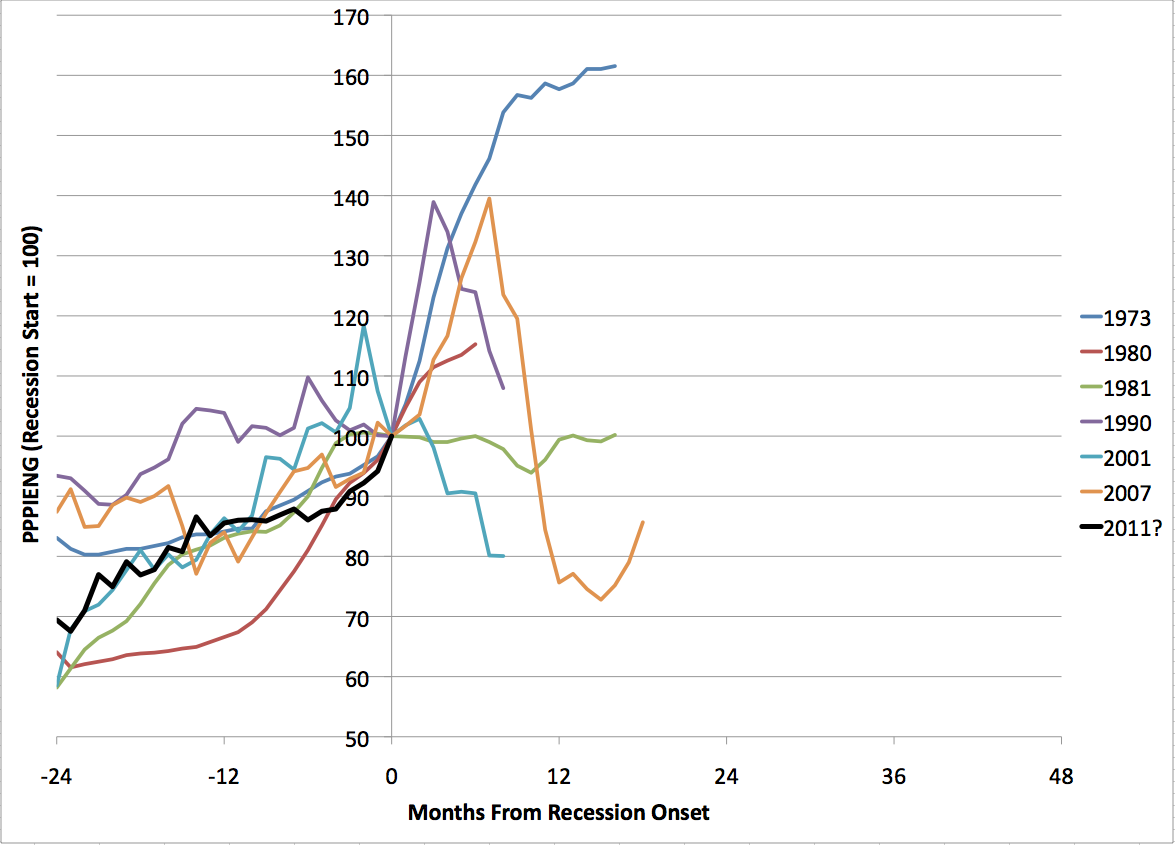
post-1970 recessions follow oil spikes
chart of recessions after oil price rises
web
web
http://3.bp.blogspot.com/-pr_mWyFounI/Tb_-zUWLnNI/AAAAAAAABuE/T2OIHkYrq_Q/s1600/Screen+shot+2011-05-03+at+9.09.55+AM.png
publication
Energy Bulletin
date
2011-05-01
To visit the web page, click the title or the word "web" or the URL.